Lake Echo, Nova Scotia, Canada
Weather trend plots of observations since October 2015
This plots on this page are updated every month
Last updated 02 January 2024
These plots are interesting, but they should not be used as evidence for or against climate change. The results are not
statistically significant. The accepted criterion is 20 years of data to look for climate signals. Otherwise, we have just
sampled some inter-annual variability.
Climatology experts say we need 30 to 50 years to be sure, with 20 years considered a bare minimum. Also, global measurements
are more stable than samples at any single location, making global signals more likely to be correct. Even global conditions are
subject to several known periodic cycles, which need to be taken into account.
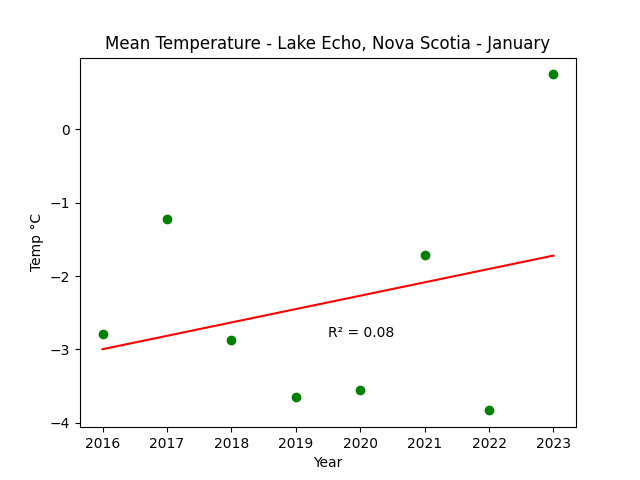
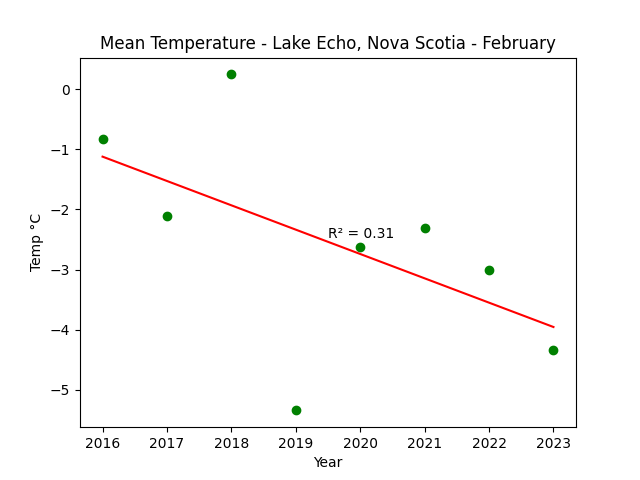
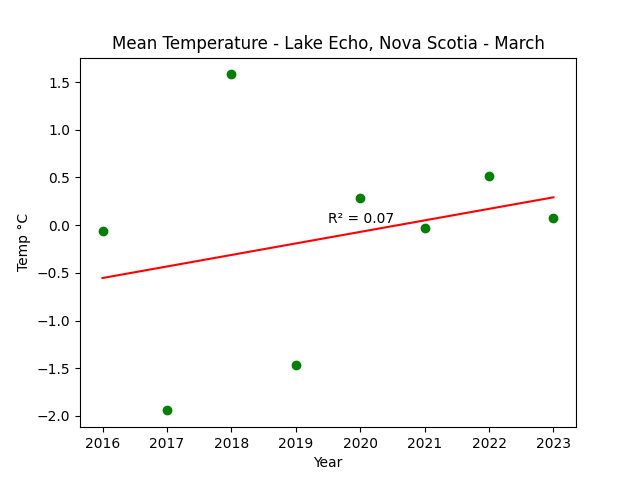
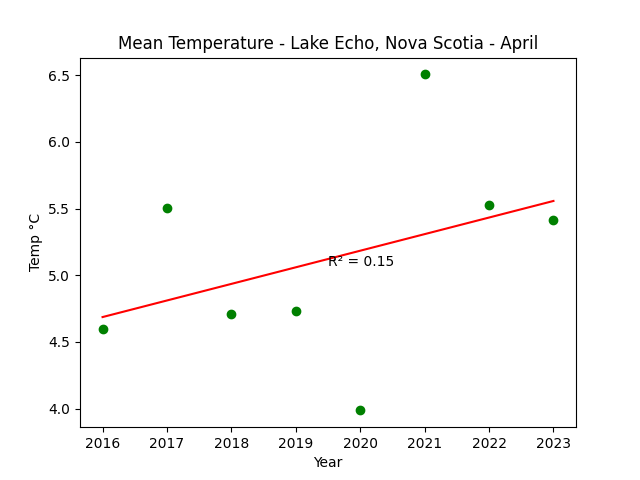
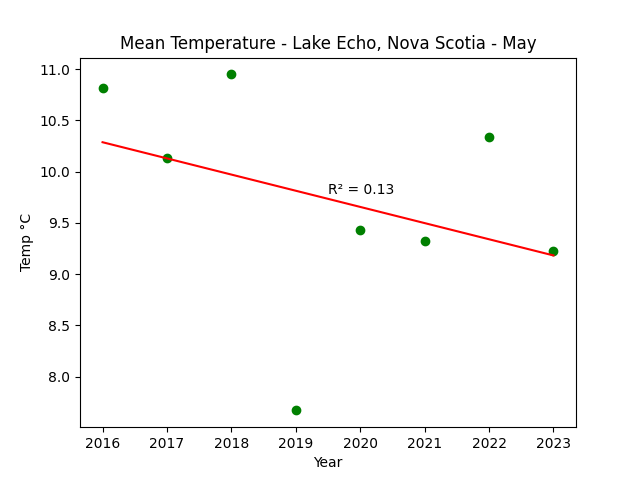
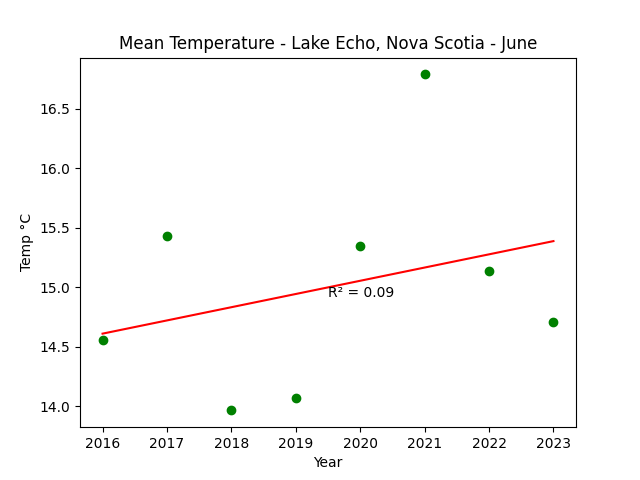
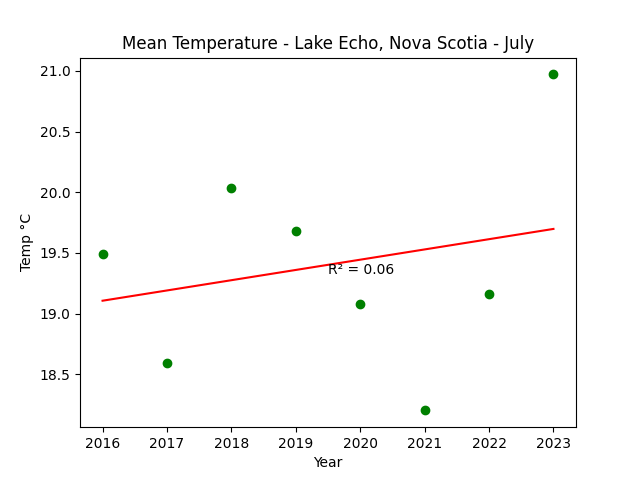
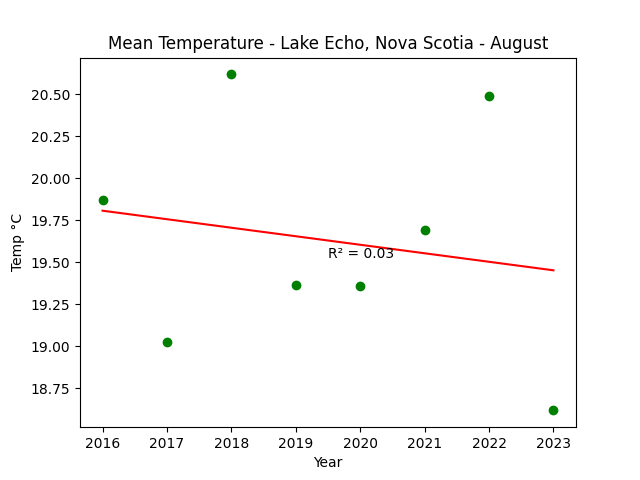
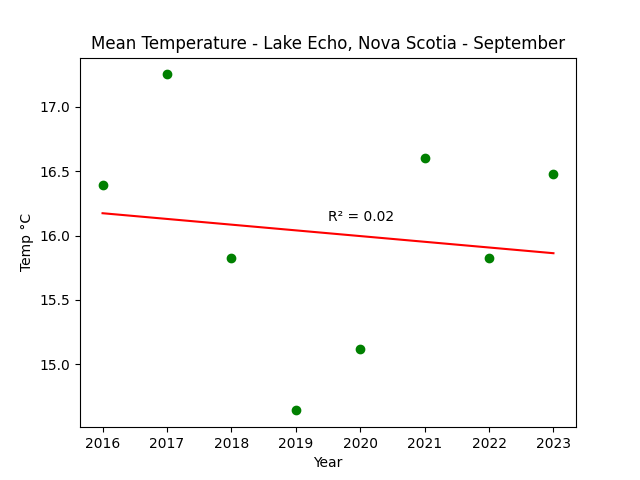
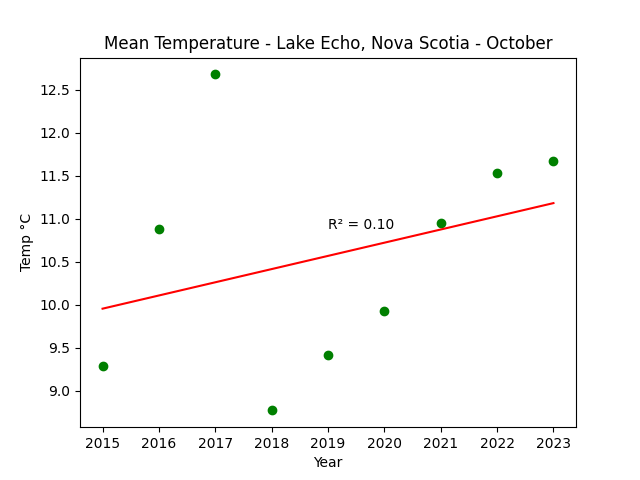
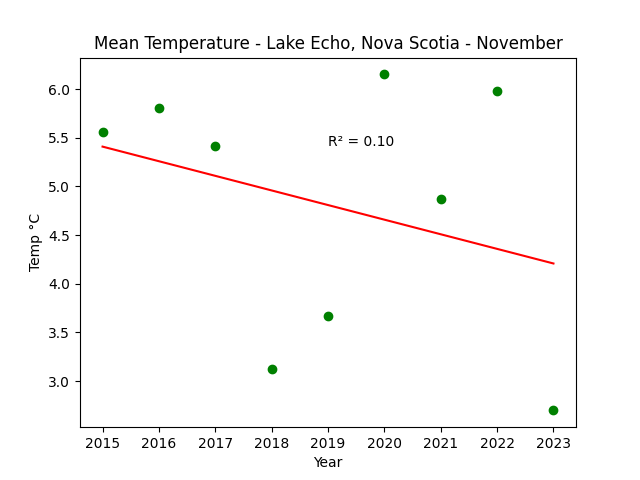
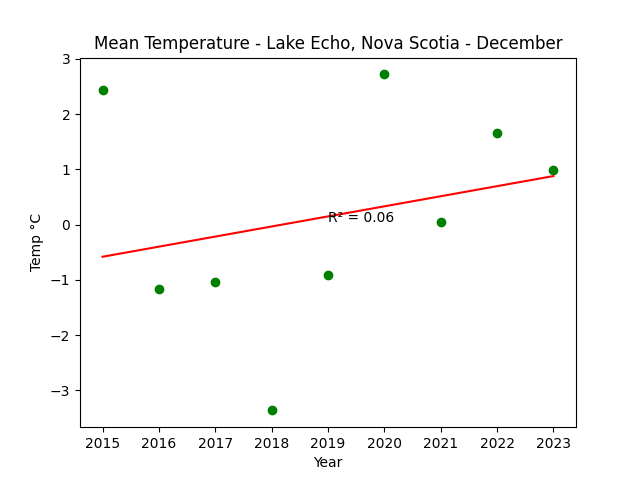
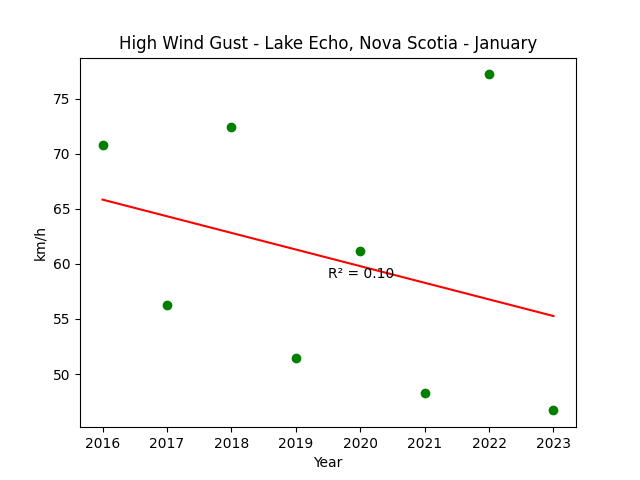
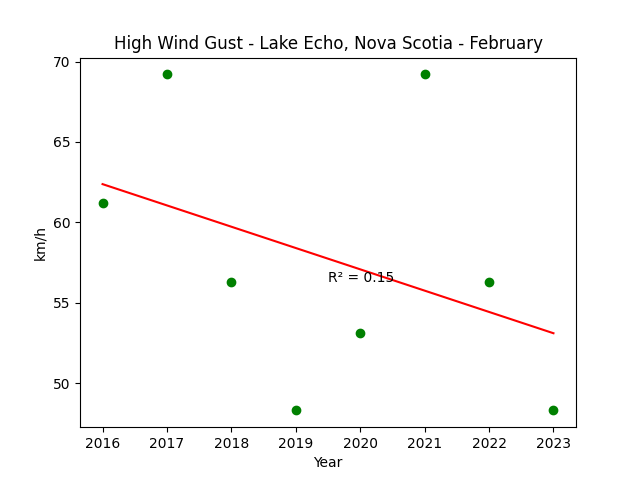
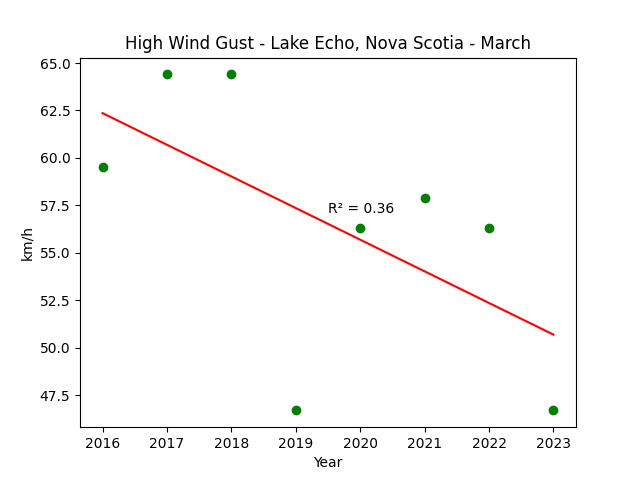
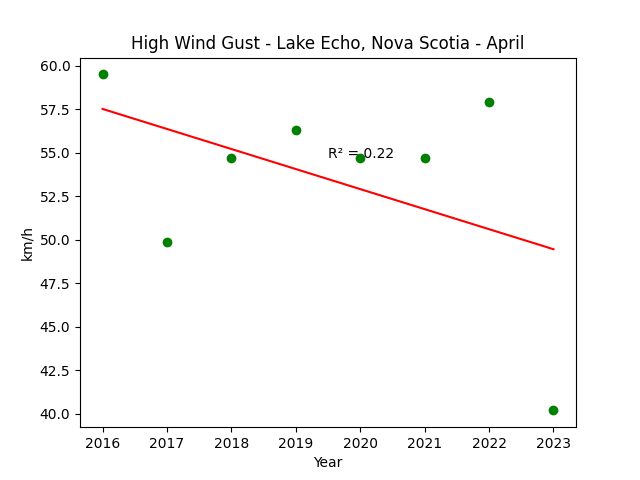
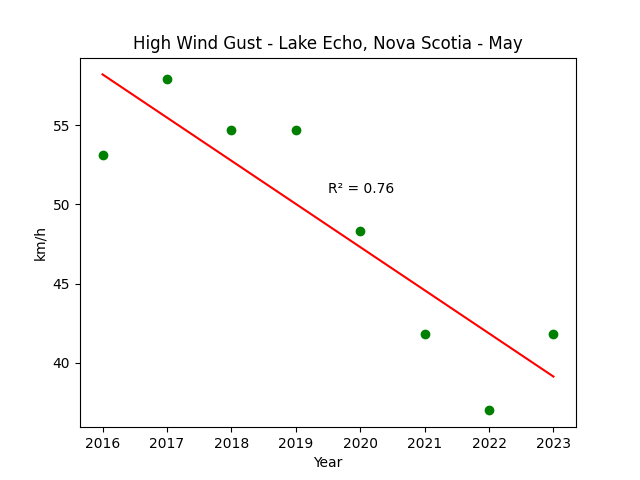
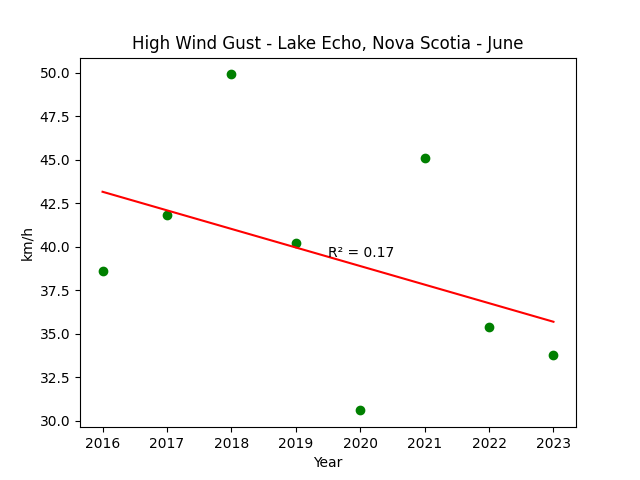
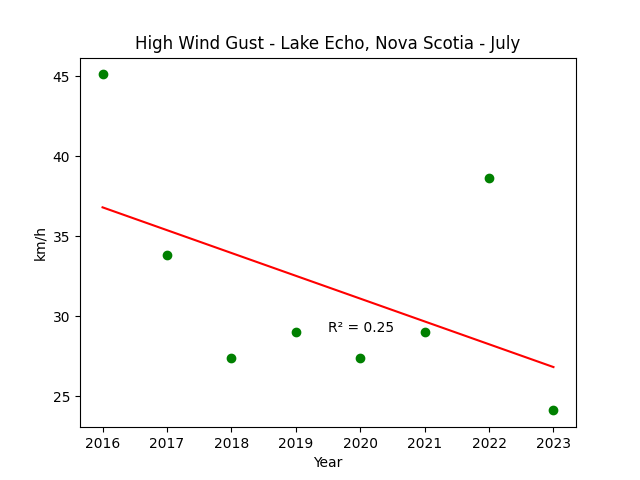
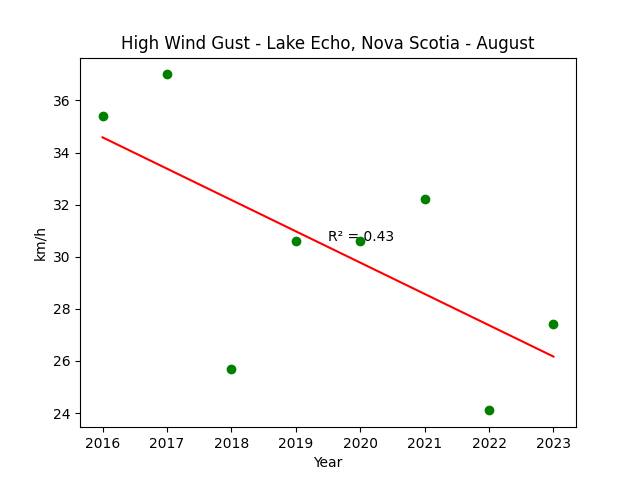
The bottom line: These plots do not mean much from a scientific point of view. Note that, generally
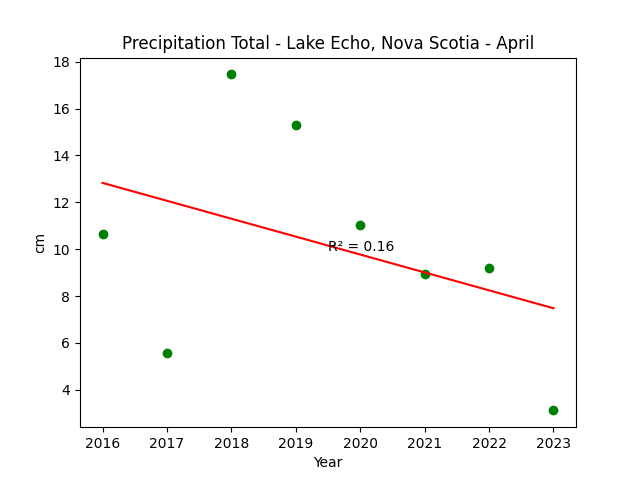
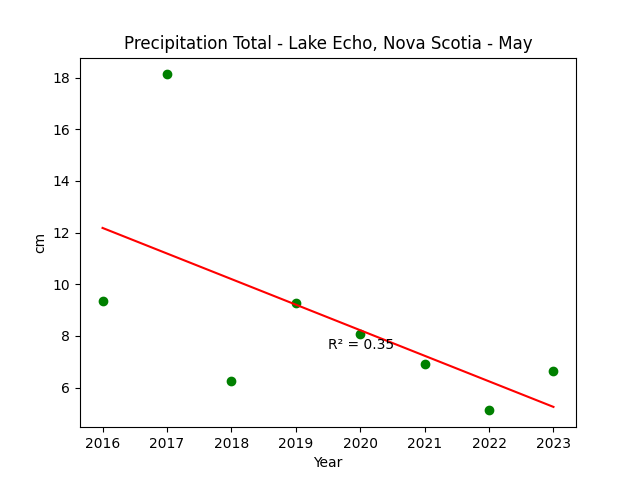
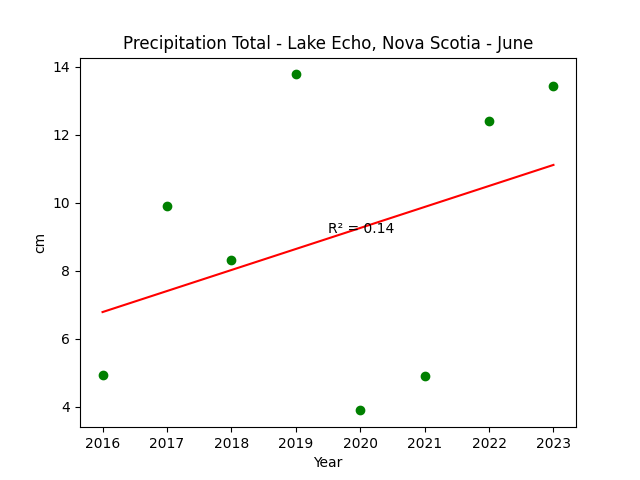
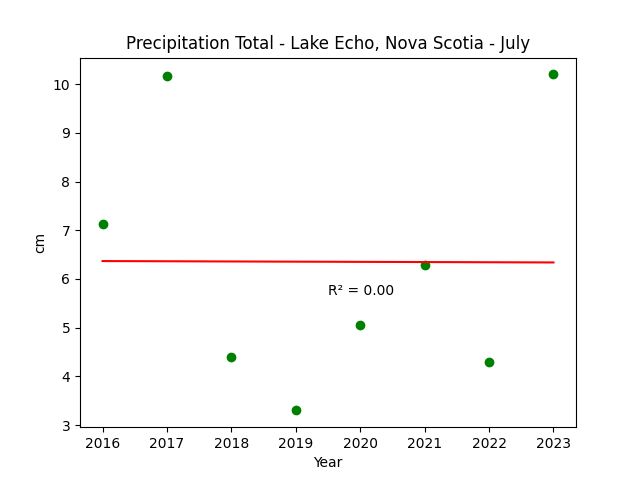
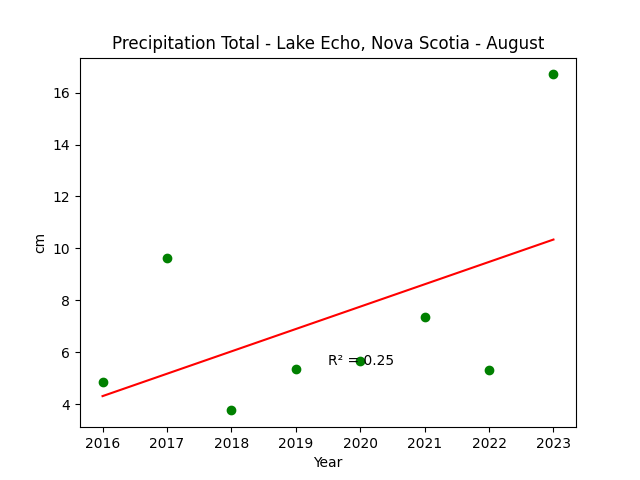
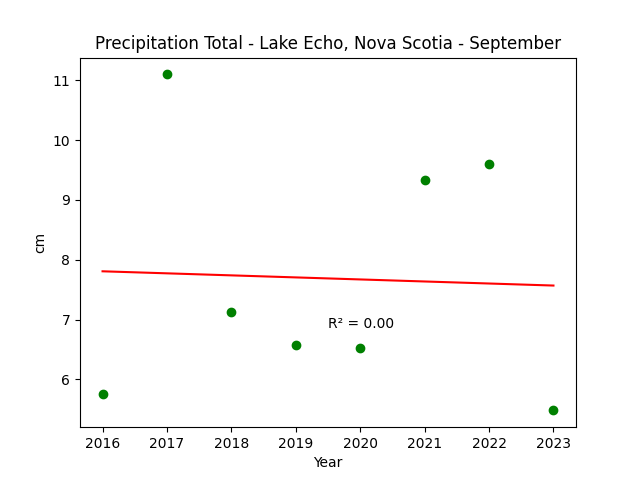
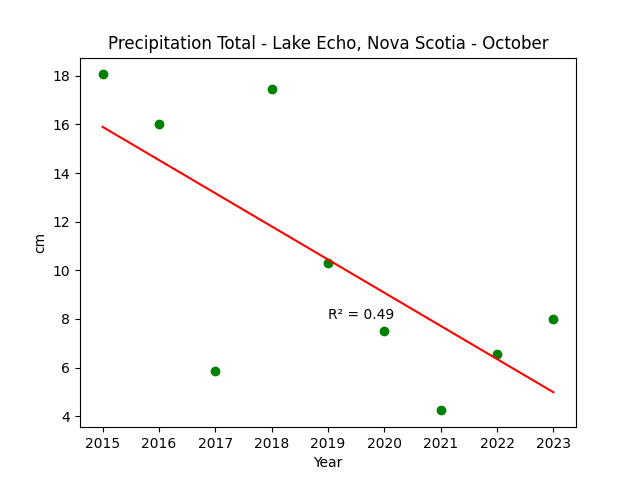
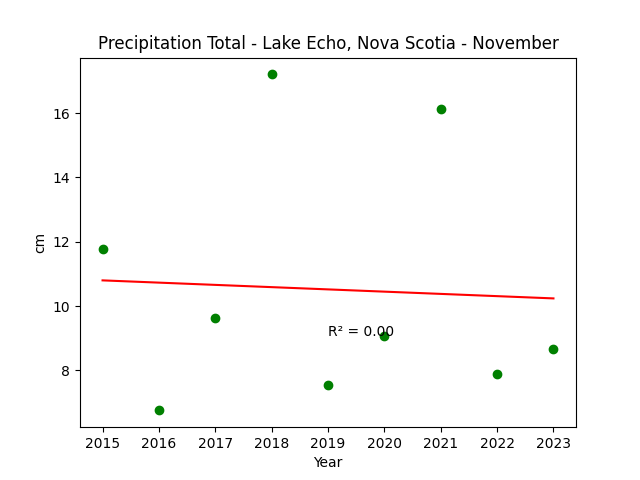
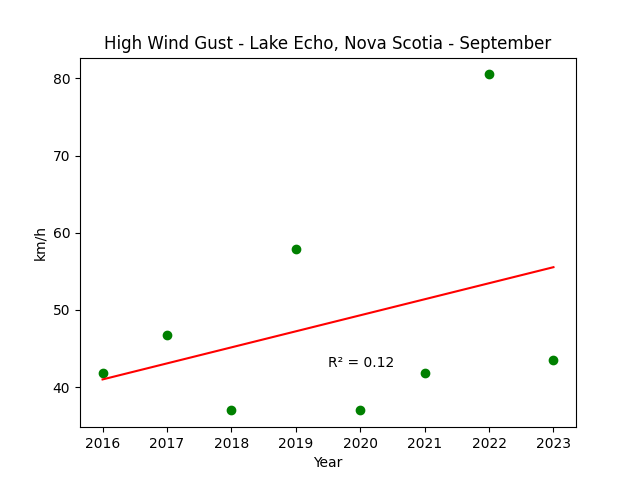
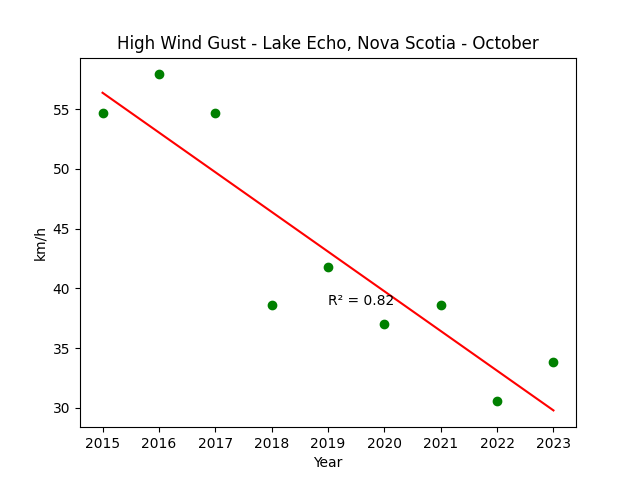
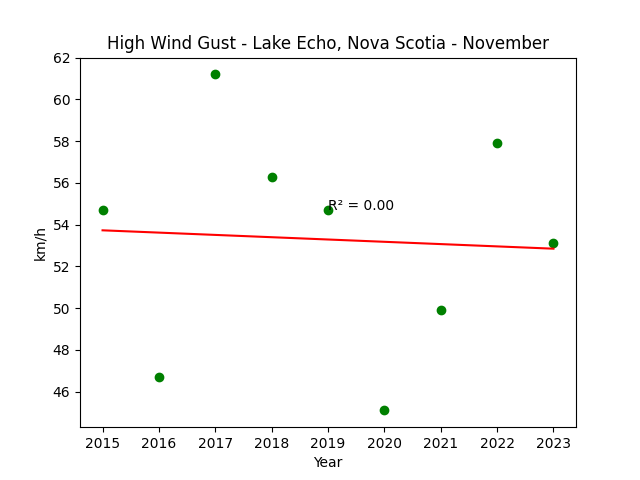
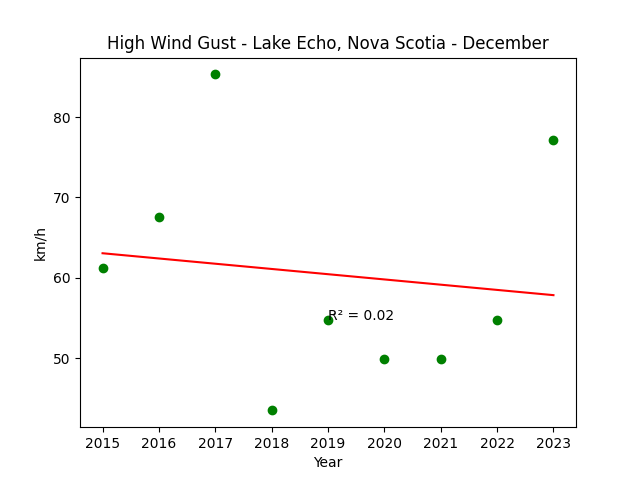
speaking, an R2 value close to 1.0 indicates a stronger relationship between the X and Y axis. With these
plots, the R2 value is quite low. Further explanation of these plots requires the expertise of a
professional statistician.
Mean Monthly Temperatures
High Wind Gusts
Precipitation
The precipitation plots for December through March are omitted. This is because there is no automated way of measuring
snowfall. Snow quantity varies dramatically depending on temperature, so it cannot be melted, with the water then
mathematically equated to snow depth. Winter precipitation in Nova Scotia is a mixture of rain, various textures of snow, and
freezing rain. As such, observations of precipitation during these months by automated weather stations are invalid.


